When working with ES6, React, or other code that must be compiled by Webpack, it can be hard debugging from the browser using DevTools because instead of your original code, it displays the compiled and minified code, which can be difficult to read.
If you run into any errors, it’s going to point you to a line in that confusing compiled code.

Using source maps solves this problem by allowing you to debug the original code. This maps the lines of code in the compiled file to the corresponding lines in the original file.
I’ll show you how to quickly generate a source map with Webpack for easier debugging in Chrome.
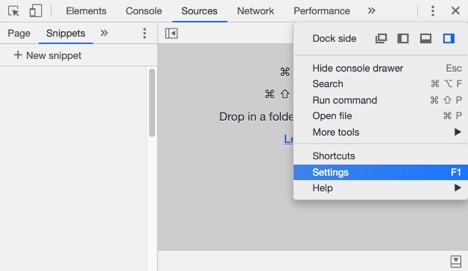
Let’s get started! In Google Chrome, open DevTools by clicking command + option + i on mac or ctrl + shift + i on Windows, then click on the three vertical dots on the upper right side to bring up the setting menu. Next, click on “Settings”.

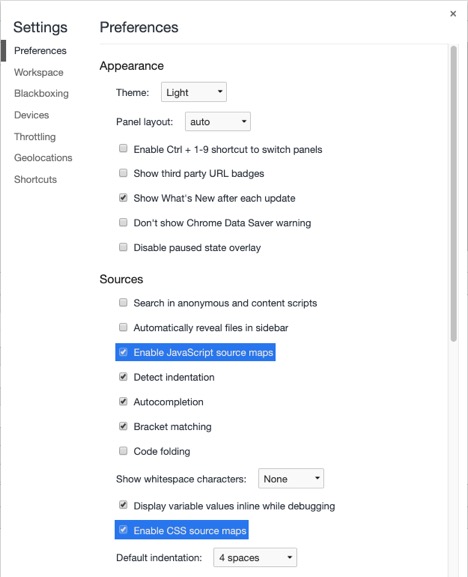
In the “Preferences” tab, make sure that both “Enable JavaScript source maps” and “Enable CSS source maps” are ticked.

To generate source maps with Webpack running in production, all you have to do is add the devtool and sourceMapFilename properties to your webpack.config.js file.
module.exports = {
  entry: {
    app: `${__dirname}/src/index.jsx`
  },
  output: {
    filename: '[name].js',
    sourceMapFilename: '[name].js.map',
    path: `${__dirname}/dist`
  },
devtool: 'source-map'
};
If you’d like to debug in development, remove any -d (for development) or -p (for production) flags from your Webpack script and set the devtool property in webpack.config.js to eval-source-map. Erik Aybar
Next, you need to add a comment with the sourceMappingURL to the end of your file to be compiled. This points to the source map.
//# sourceMappingURL=/dist/app.js.map
When you run your Webpack script, it will compile your files and generate a source map at the destination specified in your webpack.config.js file under the output path.
For reference, here is the error without source mapping:

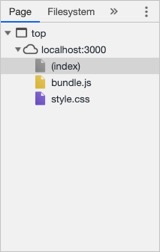
And you’ll notice that within the Page tab at the top of DevTools, it only shows the compiled file.

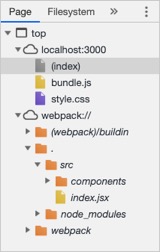
And below is what this will look like with source mapping:


Hopefully, this is as useful to you as it has been to me!